Two parameters, one loss
Prediction = 2w + b · L = (2w + b − 6)²
3D is unavailable. This image is a static reference; numerical controls still work.
Calculation, update log and notes
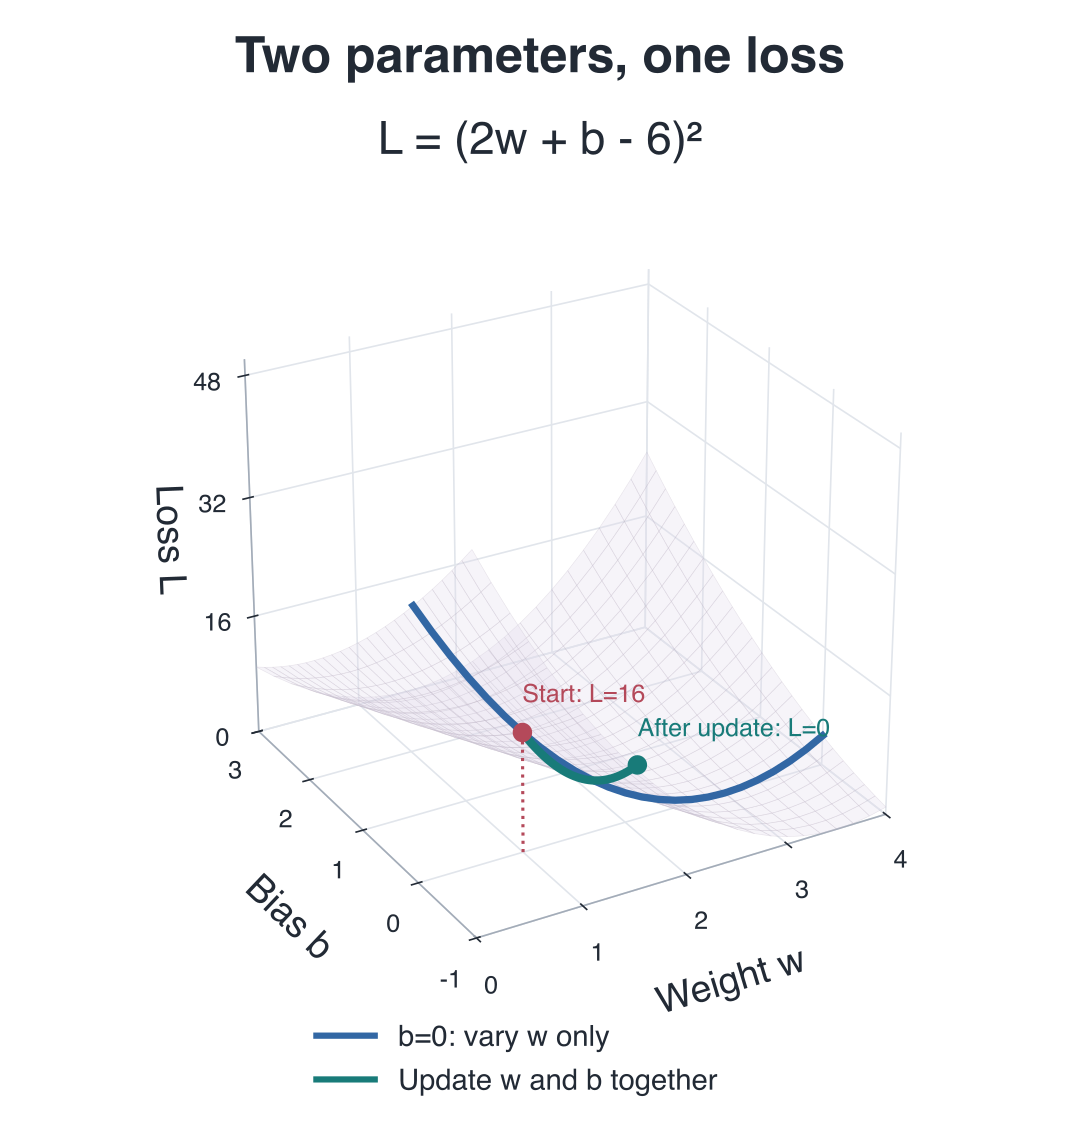
The input stays at 2 and the target at 6. The ground axes are parameters w and b; height is the same squared loss. The valley satisfies 2w+b=6, so one problem cannot uniquely determine both parameters.
Only the endpoints perform a parameter update. The green path samples 64 intervals along the straight parameter segment between old and new values, recalculating L at every sample. It shows loss while crossing the valley; it is not a straight line between endpoint losses. The yellow arrow shows the direction of −∇L in the parameter plane, with its length scaled for display.
From w=1, b=0, rate 0.1 gives L=0.64 for w only, or L=0 for both. Rate 0.3 gives L=31.36 for w only, or L=64 for both. An oversized step crosses the valley. Both derivatives are calculated at the same old point.
The initial view is fixed, so a finger can scroll the page over the plot. Enable rotation to drag. With the plot focused, arrow keys rotate and Home resets the view. All data, calculations and graphics work offline.
Plot domain (linear height scale)
Updates
| Step | Changed | Parameters (w, b) | Loss L |
|---|
No update yet.
Data and formula: code/artifacts/lessons/l04.json · Open the original static figure ↗